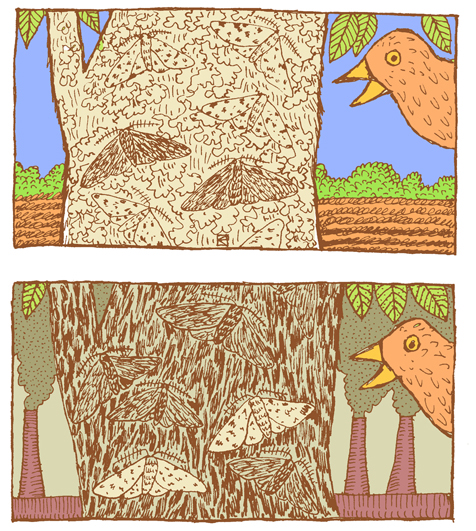
Natural selection is part of every state’s high school science standards, but that doesn’t mean we teachers are always successful in connecting our students with the topic. If your students are like mine, I’m sure you get some disconcerting responses when you ask them to explain how a feature of a species, like the dark color of peppered moths, could have evolved by natural selection. For example, one student wrote, “The moth most likely changed color due to the fact that its environment did as well. It needed to blend in with its surroundings so it became darker.” This student is demonstrating a few troubling misconceptions—most prominently that evolution happens to individual organisms in their lifetimes (not populations over generations), a common mistake made by many beginning students.

What can we do to help this student? Yes, it’s important to get students to focus on the individual level, where differences in color affect the survival and reproductive success of the moths, But it’s imperative that we don’t stop there. Students have to understand that changes resulting from these fitness differences accumulate over generations at the population level. For this, it helps for students to have some background in basic statistical concepts, something that is not always covered in introductory textbooks or materials. Fortunately, there is the HHMI BioInteractive web site.
The BioInteractive web site has a wealth of resources for teaching natural selection. Some of my favorites are available at Evolution in Action: Data Analysis, a set of activities dealing with the evolution of Darwin’s finches during a 1977 drought. One of the resources is an Excel spreadsheet packed with real data collected by the famous biology duo, Peter and Rosemary Grant, on finch beak size, body weight, wing length, and lower leg length. Data are provided for 50 finches that died during the drought and 50 that survived. I have students construct bar graphs of the means for each trait with error bars representing 95% confidence intervals so they can see the change in the average size of the birds as a result of the drought. Constructing and interpreting error bars is an important skill they need for success on the AP Biology Exam. More importantly, I also have them construct separate histograms for beak depths of survivors and non-survivors. By calculating mean beak depths for each group of birds, they can see that the birds that died had a mean beak depth of 9.11 millimeters (mm) while the survivors had a mean beak depth of 9.67 mm—from this they can draw the same conclusion drawn by the Grants, that beak depth was the most important factor determining whether finches survived the drought or perished without leaving offspring. It’s powerful to be able to draw important conclusions like this from data, and has a much longer-lasting impact than if I were to just tell my students “it was beak depth” from the beginning.
Following the class discussion, we watch the short film The Beak of the Finch, in which the Grants take us through their research process and major findings. While watching the film, students learn that prior to the drought, there was a range of seeds varying in size and hardness available for the birds to eat, but during the drought there were only the large, hard seeds of cactus bushes. Finches with smaller beaks were unable to crack the large, hard cactus seeds. 80% of the birds died, mostly those with smaller than average beaks. The mean beak depth of the medium ground finch population increased following the drought as a result of differential survival and reproductive success. Importantly, students can see that individual finches did not change the size of their beaks. Change occurred in the distribution of beak depths at the population level as a result of the interactions that occurred between individual organisms and their environment. Selection acts on individuals, then the population evolves. All of this can clearly be tied directly to the data analysis the students did prior to the film, which helps to reinforce these conclusions.
 Following instruction, my students construct better explanations of evolutionary changes caused by natural selection. Here’s that same student’s response to the peppered moth prompt after instruction with HHMI’s BioInteractive resources: “When the Industrial Revolution began the more common color of the moth was probably lighter, but there were still some variations in the population that had darker coloring. When the moths’ environment became darker, the few darker colored moths were more likely to survive and reproduce, while the lighter moths probably died before producing offspring because they were not well hidden. Over time, the genes for darker color became more popular and there were less light colored moths.” Not bad, right?
This is just one example of how the HHMI BioInteractive resources have helped to improve my teaching and my students’ understanding. The HHMI BioInteractive web site is a rich source of well-designed, expertly reviewed, and teacher-tested instructional resources for teaching evolution. There is also a growing list of resources for teaching earth and environmental sciences. I encourage you to check it out.
Bob Cooper teaches biology at Pennsbury High School in Fairless Hills, PA and is a teacher ambassador for HHMI. He has been a supporter of NCSE for many years.
