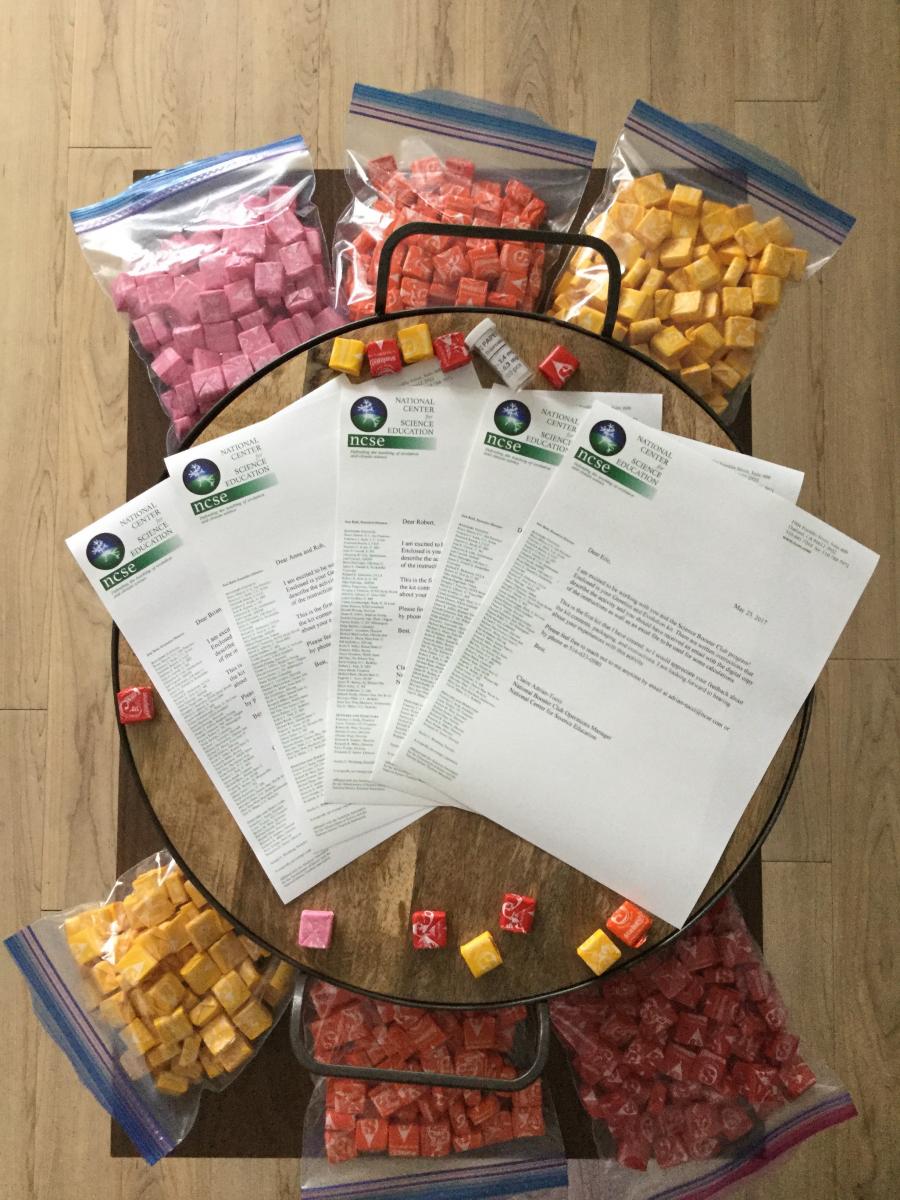
This past month in my new role as the SBC Operations Manager, I’ve been working with Emily Schoerning and our Science Booster Club leaders around the country. SBC leaders receive kits with materials to run activities that we have developed. You might remember Emily’s January post about sending out the Ocean Carbon Crisis activity: mailing tubes galore!
Since our last kit activity was about climate change, it was time we sent our leaders an activity about evolution. To do this, I teamed up with my longtime friends and Iowa City Science Booster Club interns Laura Bankers and Joseph Jalinsky, who helped to develop the activity and did a ton of work optimizing it in Iowa.
This activity has two components. The first is aimed at introducing people to DNA, genes, and alleles by demonstrating standing genetic variation. We give each person a PTC (phenylthiocarbamide) taster strip. The allele for tasting the bitter chemical is dominant to the non-tasting allele. Testing for the presence of the allele can be a humorous demonstration.

At an event a few weeks ago, a man could not believe that his wife could taste something. “That’s not bitter, it’s just paper!” he shouted. It was pretty funny when his young son made a funny face after tasting the strip. Clearly, the son had inherited the taster allele from his mom.*
The second component of the kit is a demonstration of how two different evolutionary processes change allele frequencies in populations. Because determining the number of individuals for each generation requires some number crunching, a task that causes many people anxiety, we soothed people’s nerves by performing math with candy.
Enter 60 pounds of Starbursts.That’s right. In order to supply all of our clubs with enough Starbursts to model the activity and allow participants to eat a few candies, I started with 60 pounds of candy. (Amazon’s algorithm must have been impressed by this exciting purchase. I continue to get e-mails about how I can buy dozens of pounds of a wide variety of candies.)
After sorting all of the Starbursts (thanks, Amber and Margaret!), I was ready to model a population of Starburst organisms with four different alleles for the color gene (red, pink, orange and yellow). The game starts with 60 Starbursts (15 of each color). Participants take turns passing around bowls of candy and remove (and eat!) the Starbursts. The process they use to choose which candy they will eat dictates the evolutionary process they are modeling.
In order to model genetic drift, players remove candy from the bag without looking, meaning that each candy is equally likely to be removed As Laura suggested, players can think of this scenario as if they are an owl preying on four different colored mice. In the drift mode, all of the mice are equally tasty.
In the second version of the game, participants model natural selection by deciding which colors they are going to remove from the bag. In this scenario, players might think of themselves as an owl that prefers certain color mice over others. In this scenario, players can only remove the agreed upon color on their turn.
After the bag has been passed around to all of the players, it is time to calculate the next generation of candy. First, participants find the proportion of each color left in the bag, and then multiply the proportion by the total number of individuals, 60. Subtract this number from the number of each colored candy remaining in the bag to determine the number of each color to add back. For example, if there are 44 candies remaining, and just 12 are red, then red represents roughly 27% of the remaining candy (12/44 = 0.27). Next, multiply the total number of candies in the next generation (always 60) by 0.27 to get the total number of reds needed: 0.27 · 60 = 16.2 (round down to 16). Because there are 12 currently in the bowl, players would add 4 red candies.
Players continue this process for a few rounds, making sure to keep track of the number of each candy after they add back the Starbursts. After just four generations, there should be enough data to compare the outcome of drift vs. selection on the population. The leader does the math on a whiteboard or using an Excel spreadsheet, depending on their preference. The hardest thing participants have to do is decide whether to prey on strawberry (obviously) or orange Starbursts: a topic of contention among the team here at NCSE, because Emily is the only person I know who likes the orange ones. 
I look forward to hearing from our booster club leaders about how successful this activity is in their communities. Interested in starting a booster club? Send me an email at adrian-tucci@ncse.com
*Generally, we advise booster club leaders and volunteers not to make pedigrees with families as this can bring up sensitive topics. But sometimes, this type of data collection is inevitable.

